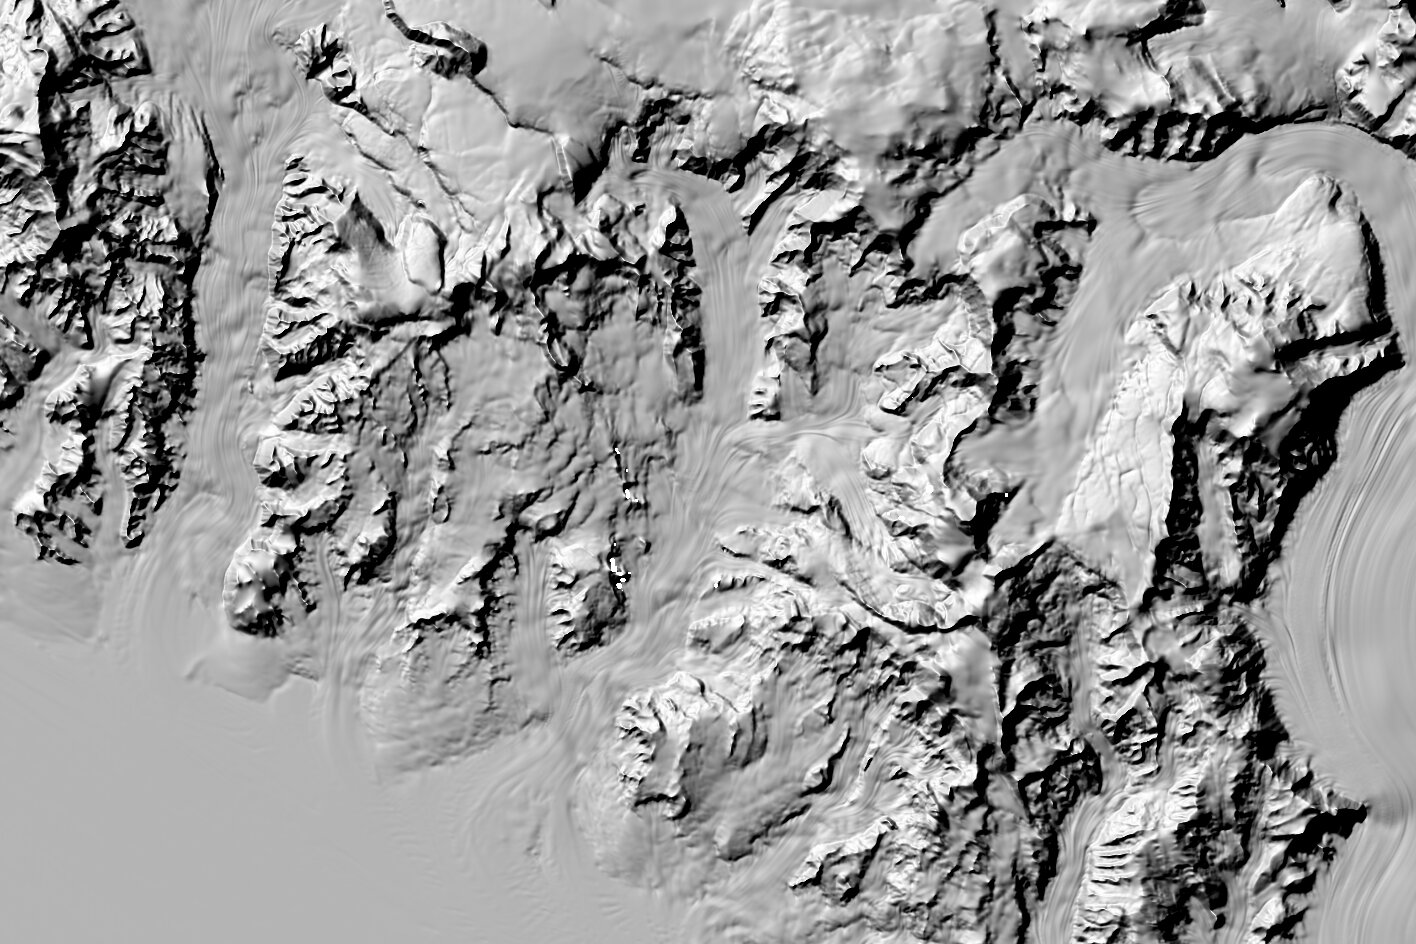
 of the central Trans-Antarctic highlands in stunning detail. Credit: University of Minnesota Polar Geospatial Center from satellites owned by Maxar and licensed by the National Geospatial-Intelligence Agency.")
With four more years of satellite imagery data, researchers at the University of Minnesota’s Polar Geospatial Center and their partners have now released the most detailed terrain maps of the polar region ever created. This image shows a Reference Elevation Model of Antarctica (REMA) of the central Trans-Antarctic highlands in stunning detail. Credit: University of Minnesota Polar Geospatial Center from satellites owned by Maxar and licensed by the National Geospatial-Intelligence Agency.
A team of researchers led by the University of Minnesota Twin Cities released an additional four years of high-resolution imagery data, which was added to eight years of previous data, to create the most detailed terrain maps of the polar region. never created. The maps use high-resolution satellite data to show the polar regions in stunning detail and will provide new insights into the effects of climate change over time.
The researchers partnered with Amazon Web Services to make high-resolution imagery data freely available to the public in the cloud.
“Our previous data has resulted in more than 300 scientific publications,” said Claire Porter, acting co-director of the Polar Geospatial Center at the University of Minnesota Twin Cities. “With four more years of even more accessible data, these are transformative datasets. We’re excited to see what scientists will discover about how our Earth is changing.”
The project began with images taken from a constellation of polar-orbiting satellites about 400 to 700 kilometers above Earth. Polar Geospatial Center researchers created the digital elevation models based on 50-centimeter resolution images captured by commercial satellites owned by Maxar and licensed by the National Geospatial-Intelligence Agency.
Partners from Ohio State University and the Ohio Supercomputer Center developed the software to process the images, and researchers from the University of Minnesota assembled the maps with computing resources from the University of Illinois Urbana- Champaign who provided the Blue Waters supercomputer, a leading university supercomputer. . The researchers processed millions of images to create the high-resolution topographic maps.
With the latest dataset, they were able to close all previous data gaps to provide comprehensive coverage of all polar regions north of 60⁰N (including most of Scandinavia, Greenland, northern Canada, Alaska and Siberia) and south of 60⁰S (including all of Antarctica). They have also built a seamless continent-scale terrain map in Antarctica and plan to release an Arctic version this winter.
The polar regions are particularly important because the effects of climate change are amplified at the poles. Using these digital elevation models, scientists can see the detailed topography of the terrain, including individual trees, lakes, roads, and buildings.
“In the past, researchers collected data using expensive aircraft or ground exploration at limited times of the year. Now we measure the Earth’s surface at a resolution and geographic scale that nobody’s ever seen before, and we’ve been doing it for over a decade,” Porter said.
“We were able to observe glacial change, erosion, landslides and flooding, all in incredible detail over time,” Porter added. “This is a game-changer for anyone trying to protect our planet for the future.”
Researchers release the most accurate map of the Antarctic terrain
Provided by the University of Minnesota
Quote: High-resolution maps of entire polar regions provide new clues for climate researchers (2022, October 27) Retrieved October 27, 2022 from https://phys.org/news/2022-10-high-res-entire- polar-regions-indices.html
This document is subject to copyright. Except for fair use for purposes of private study or research, no part may be reproduced without written permission. The content is provided for information only.
#Highresolution #maps #entire #polar #regions #provide #clues #climatologists